Forfatter: Paweł Radzikowski radzikpawe@gmail.com
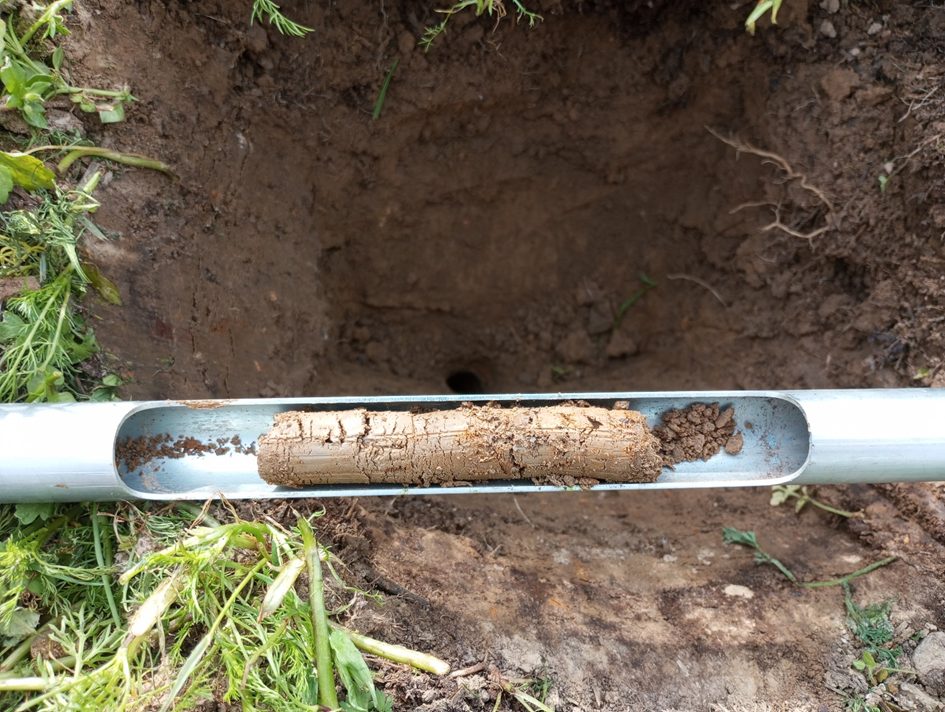
Dag 1 af overvågningen (29.04.2024): Ved ankomsten til det tyske Living Lab mødtes Paweł Radzikowski fra Ogolnopolskie Stowarzyszenie Agrolesnictwa (OSA, Polish Agroforestry Association) med Janine Raabe, landmanden fra Hof Lebensberg. De præcise placeringer af prøveudtagningsstederne blev fastlagt, og der blev udpeget kontrolsteder. Undersøgelserne blev udført i to agroforestry-systemer: systemer med blandet frugt og nødder. Kontrollen for systemet med blandede nødder var en tilstødende mark med en foderafgrøde, mens systemet med blandede frugter var en tilstødende ubeplantet mark. Under diskussionerne på stedet blev det besluttet at tilpasse den prøveudtagningsprotokol, der oprindeligt blev udviklet i opgave 3.2, til forholdene på stedet. I stedet for at bruge en gradient med fire afstande fra træerne blev der valgt to afstande: en umiddelbart ved siden af træerne og den anden midt imellem dem. Denne ændring var nødvendig, fordi træerne kun var blevet plantet et år eller to, før overvågningen begyndte, hvilket gjorde, at deres indvirkning primært kunne ses på kort afstand. Indirekte afstande forventedes ikke at være signifikante i denne sammenhæng.
Der blev etableret prøvefelter på 30 x 10 meter i begge systemer og deres respektive kontrolområder. Længden på 30 meter blev valgt, fordi visse biodiversitetsprøver krævede, at områderne lå mindst 10 meter fra hinanden. Hvis man antog, at der var behov for fire gentagelser for hver variant, ville disse være placeret langs et enkelt transekt i afstande på 0 m, 10 m, 20 m og 30 m. Bredden på 10 meter blev valgt på grund af afstanden på 20 meter mellem rækkerne af træer. Prøvetagningen blev planlagt, så transektet løb langs med træerne og nåede midten af marken (se fig. 1 til 3). Det samme arrangement blev anvendt i kontrolområdet på trods af, at marken var ensartet hele vejen igennem.
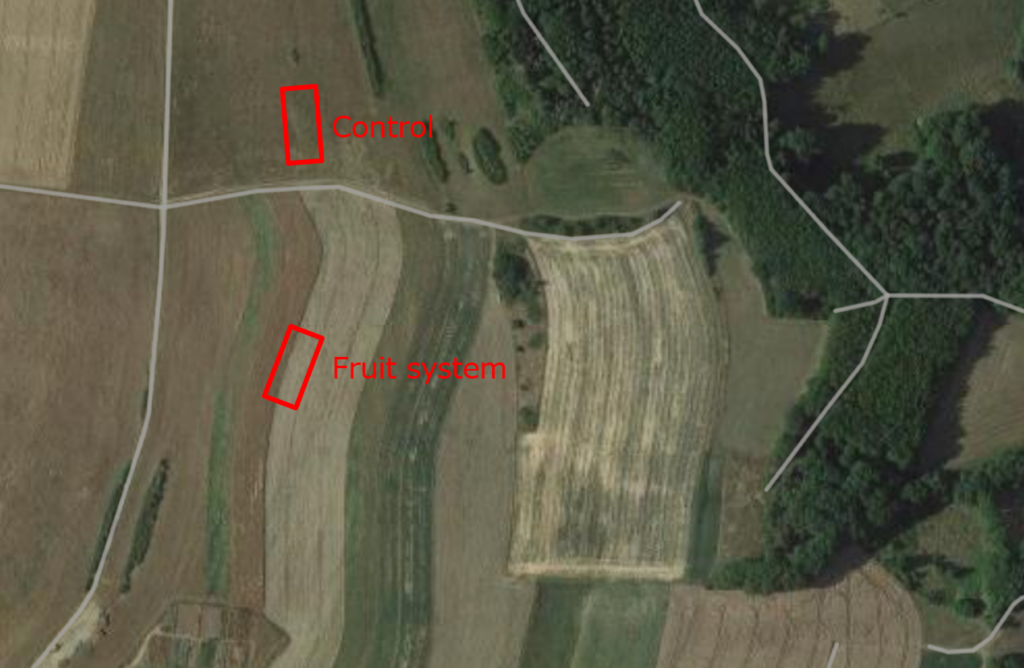
Fig. 2 Testplots i systemet med blandet frugt og kontrollen
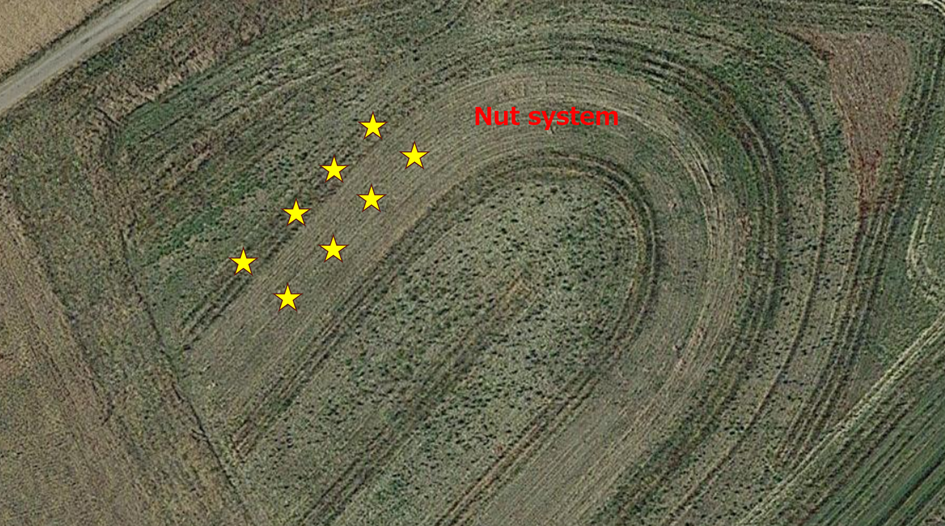
Fig. 3 Præcis placering af prøveudtagningsstederne i det blandede nøddesystem
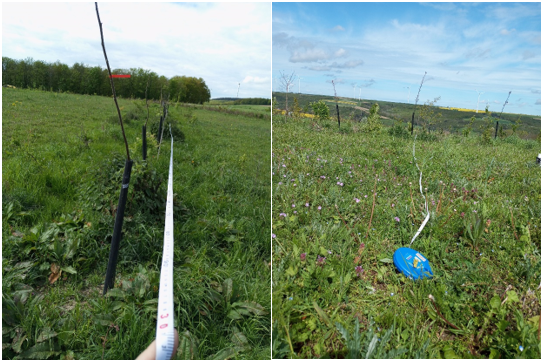
Fig. 4 Måling af længde og bredde af testplottet
Overvågningen begyndte med de mindst invasive metoder, nemlig indsamling af insekter. Denne undersøgelse blev gennemført på tværs af tre 10 meter lange transekter i hvert undersøgelsesområde (fig. 5). Der blev brugt et specialiseret entomologisk net med et 1 meter langt skaft og en hjerteformet åbning på 30 x 40 cm. Dette design gjorde det lettere at indsamle insekter fra både høj vegetation og overflader tæt på jorden. Nettets indsamlingspose er lavet af fintmasket stof, der er forstærket med et robust materialehylster (fig. 6). Insekter indsamlet under undersøgelsen blev overført til 100 ml beholdere, aflivet og konserveret ved hjælp af 75% ethanol (fig. 7). I alt blev der indsamlet 36 prøver, og identifikationen af disse insekter vil blive udført i opgave 3.2 på et senere tidspunkt.
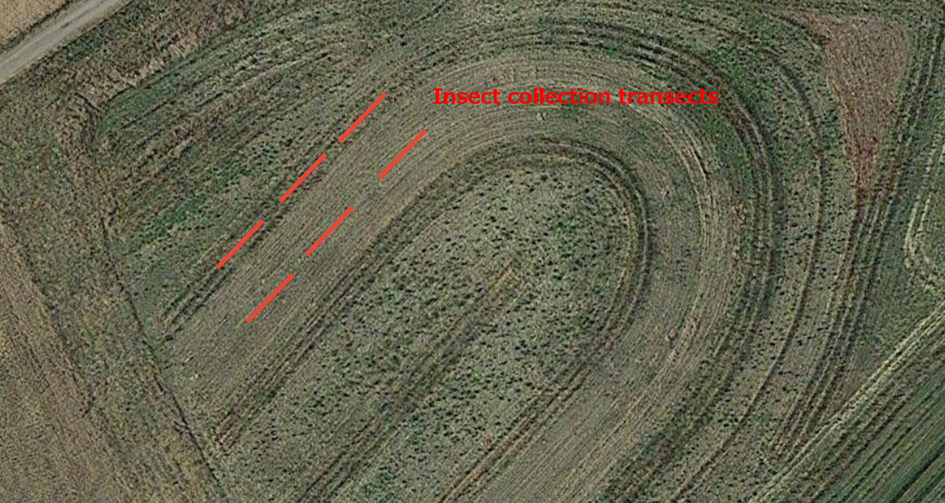
Fig. 5 Placering af transekter til indsamling af insekter
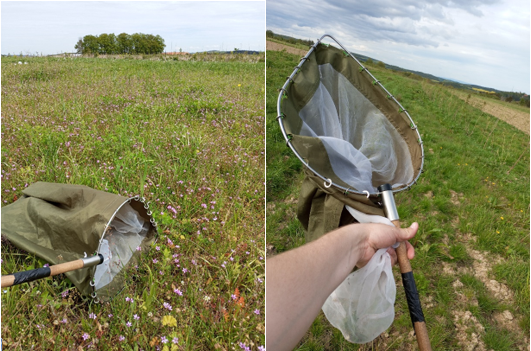
Fig. 6 Entomologisk net i brug
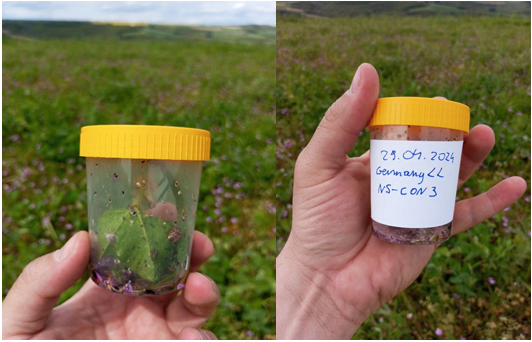
Fig. 7 Prøver indsamlet med et entomologisk net
På den første overvågningsdag var en anden opgave at sætte fælder op til indsamling af insekter i løbet af de næste fem dage. Der blev brugt to typer fælder: Barber-jordfælder og gule bestøverfælder. Disse fælder blev placeret for hver 10. meter langs de udpegede transekter med tre fælder pr. variant (fig. 8). Barber-jordfælderne med en diameter på 10 cm var designet til at fange jordinsekter effektivt. Gule bestøverfælder med en diameter på 30 cm blev placeret direkte på jorden på grund af den lave vegetationshøjde. Begge typer fælder blev fyldt to tredjedele op med en opløsning af rent vand og lugtfrit rengøringsmiddel (fig. 9). Denne opløsning sikrede en hurtig drukning af hvirvelløse dyr og forhindrede samtidig overløb under kraftig regn, og der var ikke behov for overdækning af fælderne på grund af den korte indsamlingsperiode. Vandniveauet blev genopfyldt dagligt for at forhindre fuldstændig fordampning.
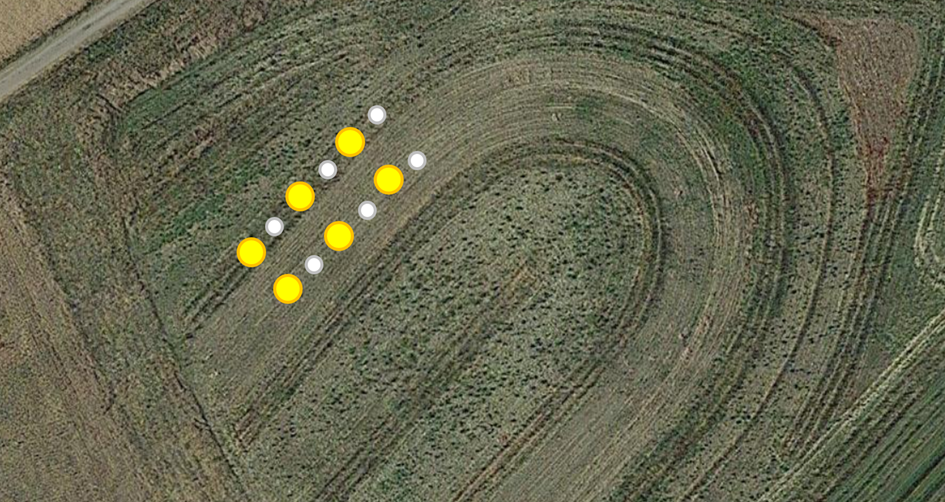
Fig. 8 Placering af Barber-fælder og gule skåle i systemet med blandede nødder
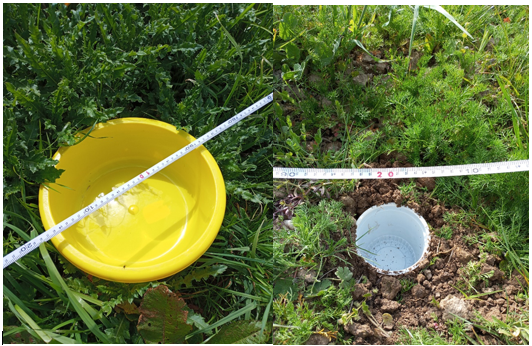
Fig. 9 Processen med at sætte gule skåle og Barber-fælder op
Dag 2 af overvågningen (23.04.2024): Vurderingen fokuserede på floraens biodiversitet og primærproduktion. Inden for hvert af de otte transekter blev der udvalgt fire punkter til fytosociologiske fotos ved hjælp af en botanisk ramme på 1×1 meter (Fig. 10). Alle plantearter blev identificeret, og deres udbredelse blev vurderet i henhold til anbefalede retningslinjer for feltprotokoller. Data blev registreret på feltskemaer (Fig. 11).
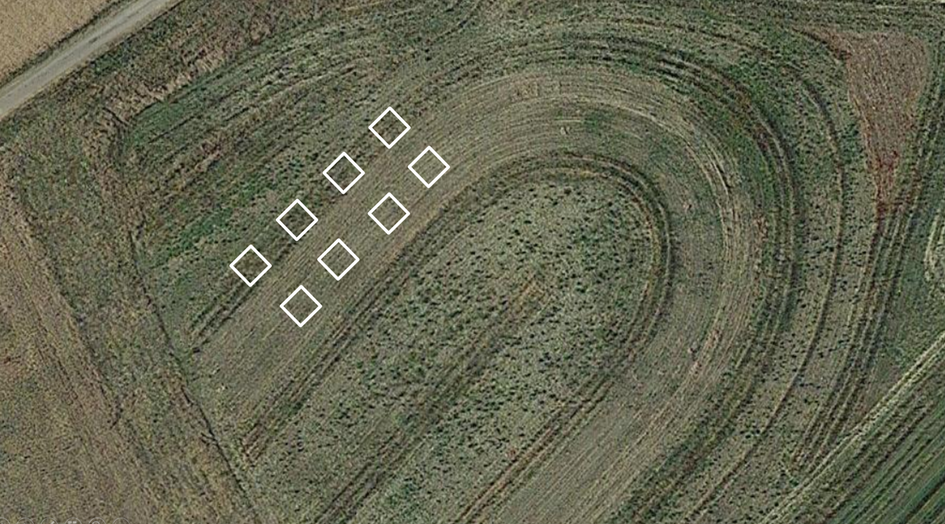
Fig. 10 Fordeling af biodiversitet og biomasseprøver i det blandede nøddesystem
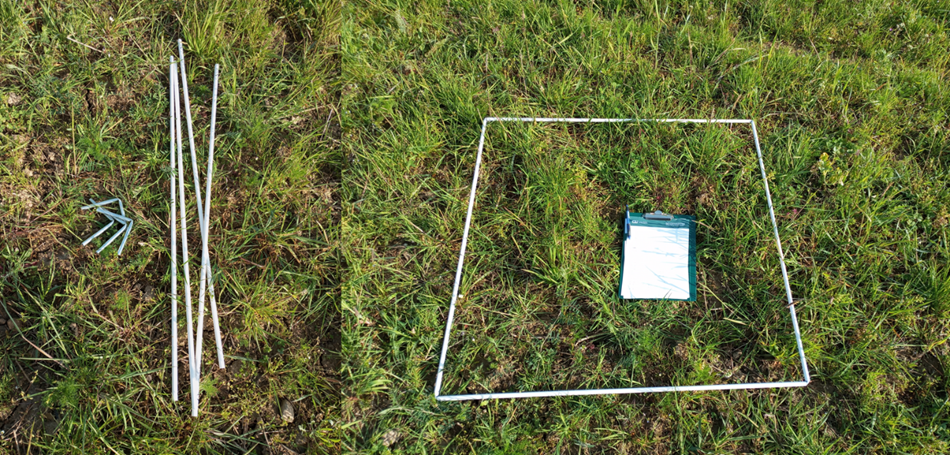
Fig. 11 Botanisk ramme og feltskema anvendt i floraundersøgelsen
Biomasse inden for de samme meterrammer blev klippet, høstet og vejet (Fig. 12). Dette gjorde det muligt at estimere udbyttet af foderafgrøder til græssende kyllinger eller vurdere økosystemets naturlige produktivitet (primærproduktion), hvis biomassen ikke var blevet høstet. På tidspunktet for overvågningen blev der ikke opnået noget udbytte fra de tilstedeværende træer, og kornmarkerne var heller ikke sået. Derudover blev der udført fotografisk dokumentation af individuelle plantearter i hvert system og deres kontrol (Fig. 13). Disse fotos blev uploadet til iNaturalist til verifikation af artsidentifikation, som bruger algoritmer og konsultation med specialister. Observationer blev geotagget for at lette sammenligninger af biodiversitet globalt (fig. 14).
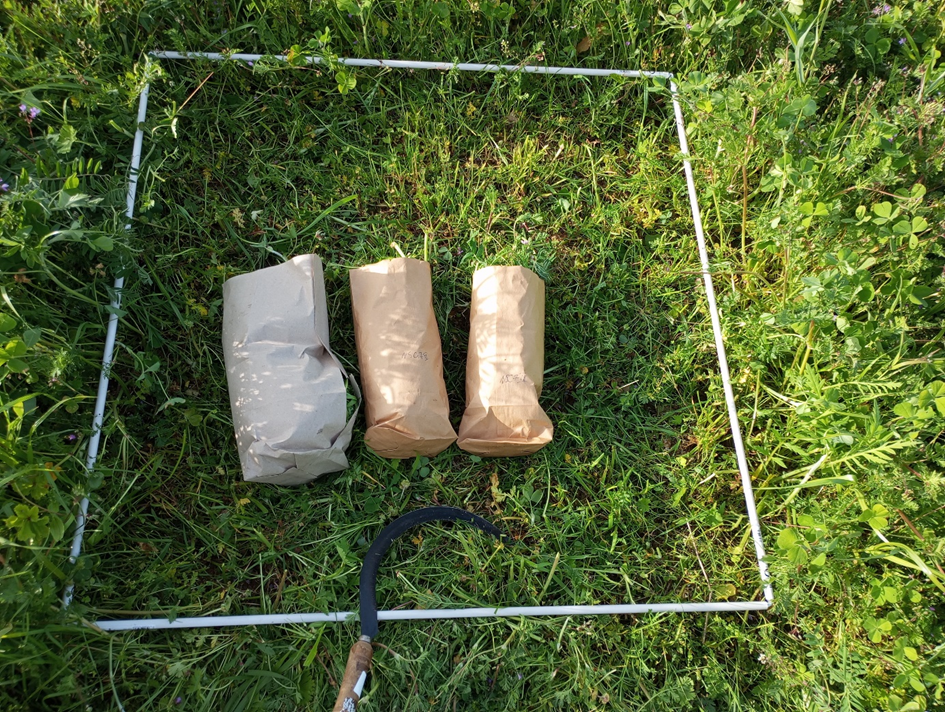
Fig. 12 Foderbiomasse høstet pr. 1 m2
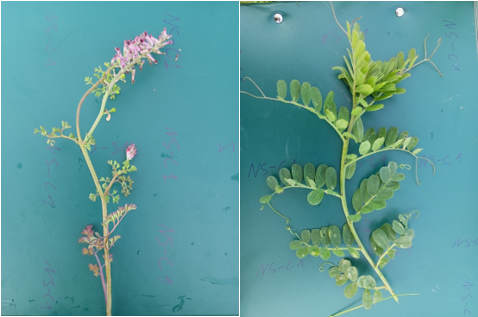
Fig. 13 Individuel fotografisk dokumentation af planter
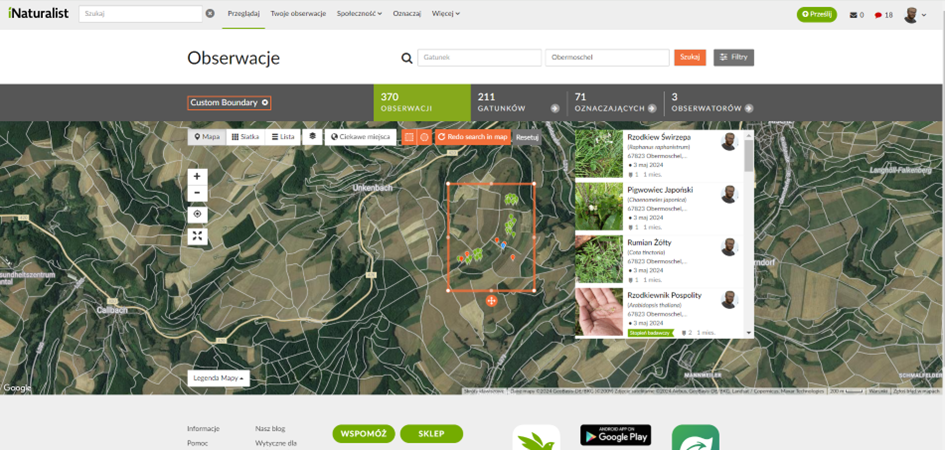
Fig. 14 Observationer indtastet på iNaturalist
Dag 3 af overvågningen (01.05.2024) - Aktiviteterne fokuserede på undersøgelse af jorddybden og indsamling af regnorme. Jordblokke på 25 x 25 x 25 cm blev udgravet i områder, hvor der var blevet indsamlet biomasse den foregående dag (fig. 15). Jorden blev omhyggeligt adskilt på et ark og yderligere udgravet for at få adgang til undergrunden. Til dybere jordlag blev der anvendt en Egner-prøvetager efter behov (fig. 16).
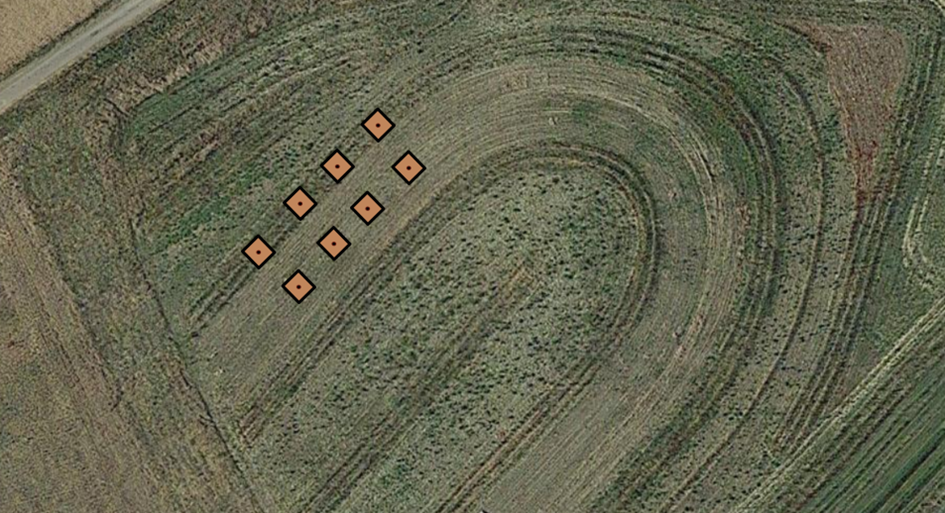
Fig. 15 Indsamlingssteder for regnorme og målinger af jorddybde
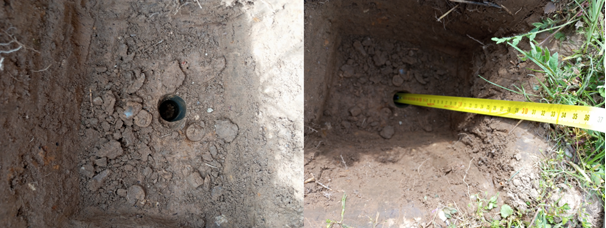
Fig. 16 Måling af jorddybde
Jorden, der blev spredt på arket, blev manuelt sigtet for at udtrække regnorme (fig. 17). De fundne eksemplarer blev opbevaret i beholdere fyldt med 75%-sprit til efterfølgende vejning og artsidentifikation (fig. 18).
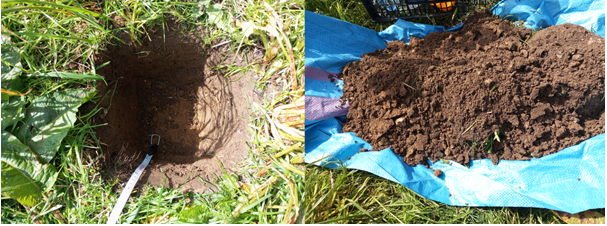
Fig. 17 Skæring af jordblok og sigtning af jord for regnorme
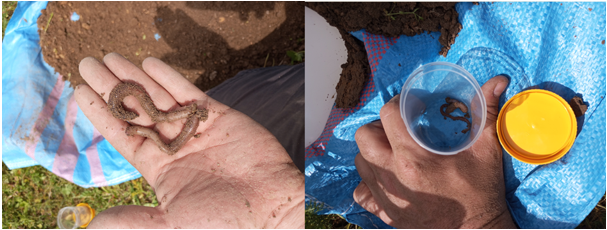
Fig. 18 Udvinding af regnorme
Dag 4 af overvågningen (2. maj 2024) - Der blev foretaget målinger af jordens bulkdensitet og permeabilitet. Prøverne blev taget i tre eksemplarer på hvert af de udpegede steder (fig. 19). Før prøveudtagningen blev små dele af græsset ryddet med en spade. Der blev brugt to typer cylindre til disse vurderinger. Små cylindre med en diameter på 5 cm blev kørt ned i jorden for at udtage prøver til massefylde (fig. 20). Prøverne blev forseglet med låg i begge ender og vil blive sendt til jordlaboratoriet til analyse på et senere tidspunkt.
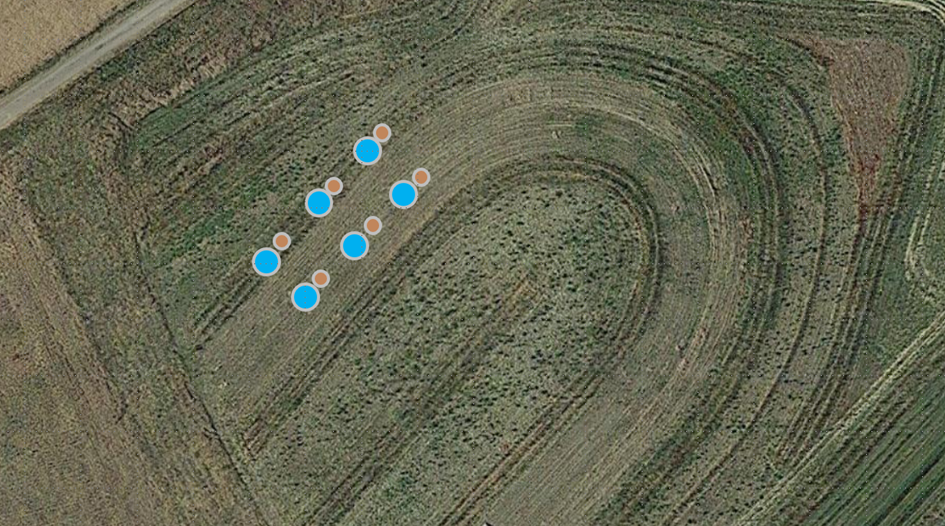
Fig. 19 Skematisk oversigt over indsamling af jordcylindre og permeabilitetstest
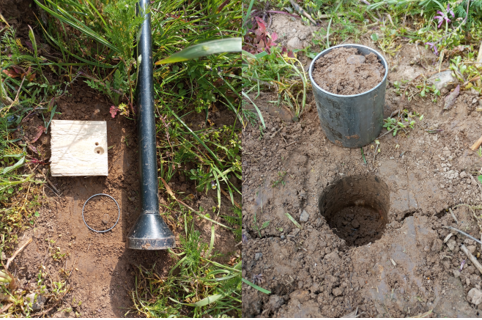
Fig. 20 Cylinderopsamling for jordens bulkdensitet
Jordens gennemtrængelighed blev vurderet ved hjælp af cylindre med en diameter på 10 cm, der blev kørt helt ned i jorden og efterlod 2,5 cm blottet med en træprop (fig. 21). Derefter blev der hældt 100 ml vand i cylinderen, og den samlede infiltrationstid blev målt med et stopur. Disse målinger blev registreret på feltdataskemaerne.
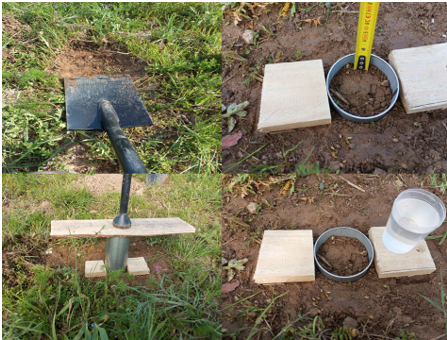
Fig. 21 Måling af jordens permeabilitet
Dag 5 af overvågningen (3. maj 2024) - Fokus var på at afslutte indsamlingen af insektfælder og jordprøver. Insektprøver fra de gule skåle og jordfælder blev filtreret og overført til forseglede beholdere med 75% ethanol (fig. 22). Identifikation af insektarter vil blive udført på et senere tidspunkt.
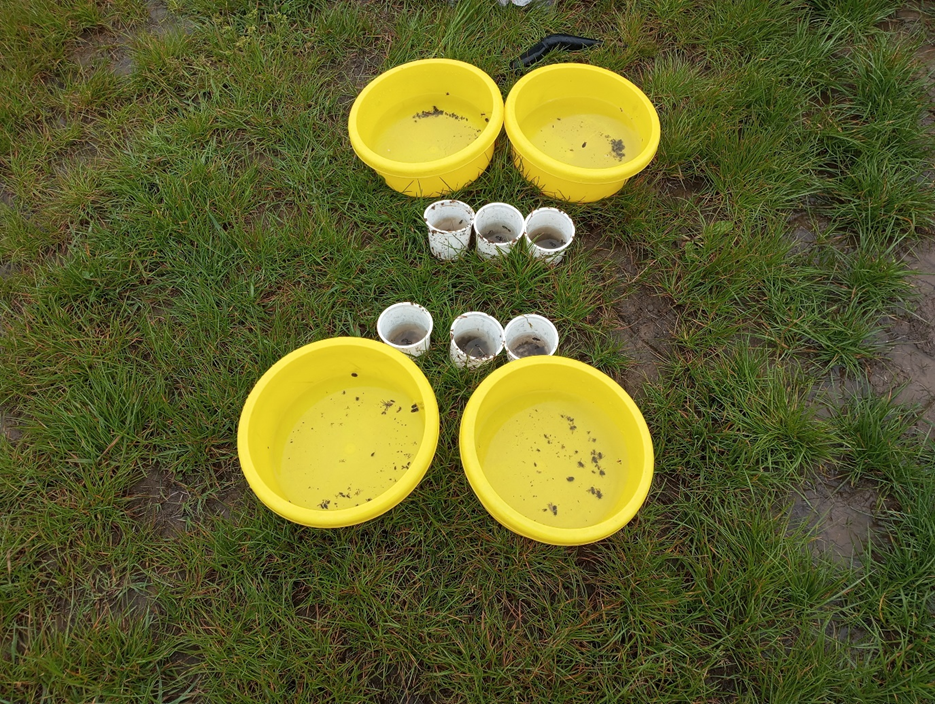
Fig. 22 Indsamling af insektfælder
Jordprøvetagning fulgte retningslinjerne i feltprotokol opgave 3.2, med fire prøver indsamlet i plastikposer fra hver variant. Hver prøve bestod af mindst fem kerner udtaget med en Egner-prøvetager (fig. 23). Prøverne blev udtaget i op til 30 cm dybde. Efter indsamlingen blev jordprøverne opbevaret i en isboks og dybfrosset, når de kom tilbage fra feltturen. Analyser af jordparametre vil blive udført i laboratoriet på et senere tidspunkt.
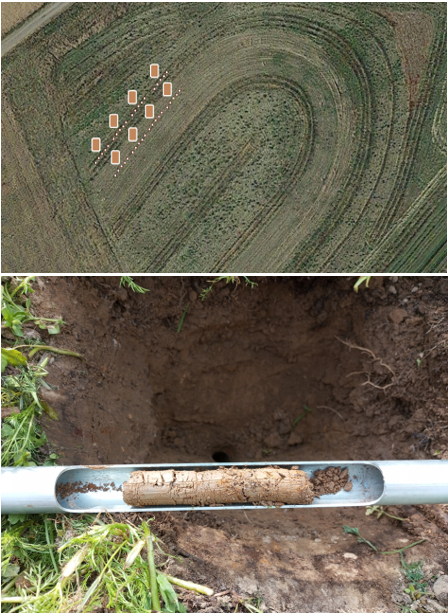
Fig. 23 Jordprøvetagningsplan (ovenfor) og en af de fem delprøver (nedenfor)