Autor: Paweł Radzikowski radzikpawe@gmail.com
Tag 1 der Überwachung (29.04.2024): Nach der Ankunft im deutschen Living Lab traf Herr Paweł Radzikowski von der Ogolnopolskie Stowarzyszenie Agrolesnictwa (OSA, Polnischer Agroforstverband) mit Frau Janine Raabe, der Landwirtin von Hof Lebensberg. Die genauen Standorte der Probenahmestellen wurden festgelegt, und es wurden Kontrollstellen bestimmt. Die Erhebungen wurden in zwei Agroforstsystemen durchgeführt: einem Mischobst- und einem Mischnuss-System. Die Kontrolle für das Nussmischsystem war ein angrenzendes Feld mit einer Futterpflanze, während das Nussmischsystem ein angrenzendes unbepflanztes Feld war. Während der Gespräche vor Ort wurde beschlossen, das ursprünglich in Aufgabe 3.2 entwickelte Probenahmeprotokoll an die Standortbedingungen anzupassen. Anstelle eines Gefälles mit vier Abständen zu den Bäumen wurden zwei Abstände gewählt: einer unmittelbar neben den Bäumen und der andere in der Mitte zwischen ihnen. Diese Änderung war notwendig, weil die Bäume erst ein oder zwei Jahre vor Beginn der Überwachung gepflanzt worden waren und ihre Auswirkungen daher vor allem in geringer Entfernung spürbar waren. Indirekte Entfernungen sollten in diesem Zusammenhang keine Rolle spielen.
In beiden Systemen und den entsprechenden Kontrollflächen wurden 30 x 10 Meter große Testflächen angelegt. Die Länge von 30 Metern wurde gewählt, weil für bestimmte Artenvielfaltstichproben ein Abstand von mindestens 10 Metern zwischen den Flächen erforderlich ist. Unter der Annahme, dass für jede Variante vier Wiederholungen erwünscht sind, würden diese entlang eines einzigen Transekts in Abständen von 0 m, 10 m, 20 m und 30 m angeordnet. Die Breite von 10 Metern wurde aufgrund des 20-Meter-Abstands zwischen den Baumreihen gewählt. Die Probenahme wurde so geplant, dass das Transekt entlang der Bäume verlief und die Mitte des Ackers erreichte (siehe Abb. 1 bis 3). Die gleiche Anordnung wurde auch für die Kontrollfläche gewählt, obwohl das Feld durchgehend einheitlich war.
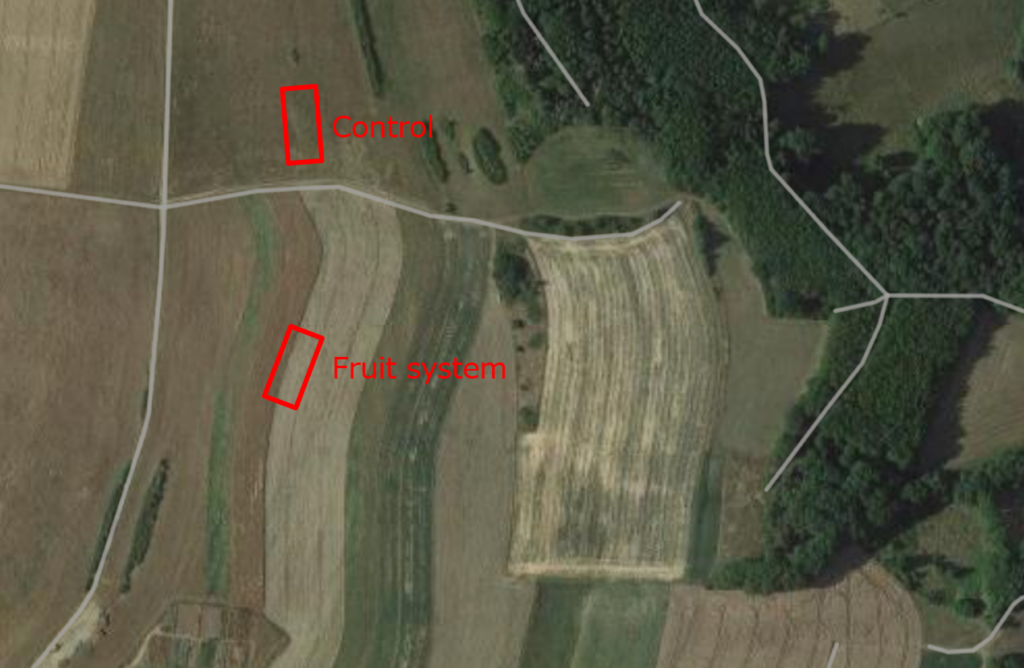
Abb. 2 Testparzellen im Mischobstsystem und in der Kontrolle
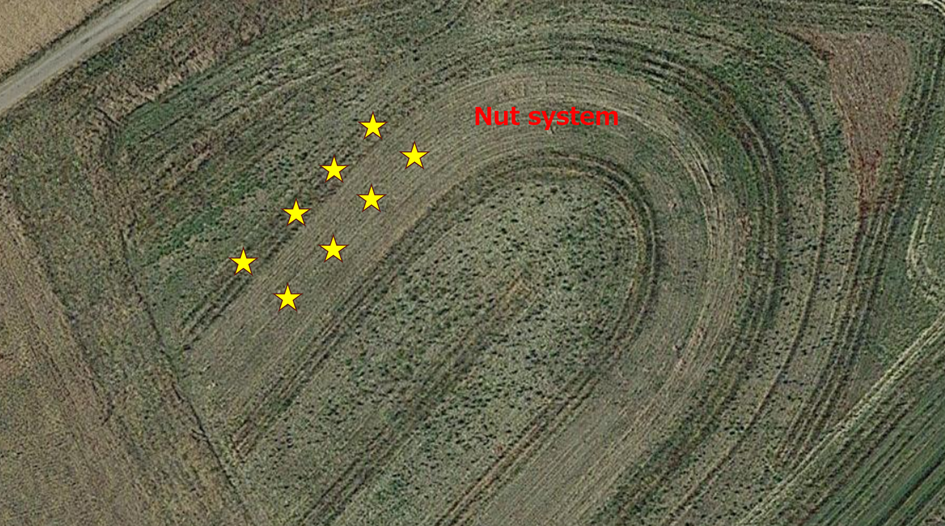
Abb. 3 Genaue Lage der Probenahmestellen im Mischnuss-System
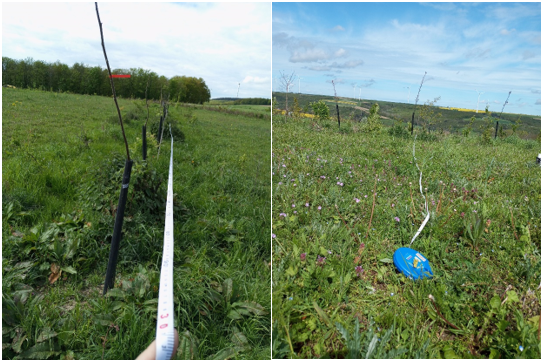
Abb. 4 Messung der Länge und Breite der Testparzelle
Die Überwachung begann mit den am wenigsten invasiven Methoden, nämlich dem Sammeln von Insekten. Diese Erhebung wurde in drei 10-Meter-Transekten in jeder Untersuchungsfläche durchgeführt (Abb. 5). Es wurde ein spezielles entomologisches Netz mit einem 1 m langen Stiel und einer herzförmigen Öffnung von 30 x 40 cm verwendet. Diese Konstruktion erleichterte das Sammeln von Insekten sowohl in der hohen Vegetation als auch auf bodennahen Flächen. Der Auffangbeutel des Netzes besteht aus feinem Maschengewebe, das mit einer stabilen Stoffhülle verstärkt ist (Abb. 6). Die während der Erhebung gesammelten Insekten wurden in 100-ml-Behälter umgefüllt, euthanasiert und mit Ethanol 75% konserviert (Abb. 7). Insgesamt wurden 36 Proben gesammelt. Die Identifizierung dieser Insekten wird zu einem späteren Zeitpunkt im Rahmen von Aufgabe 3.2 durchgeführt.
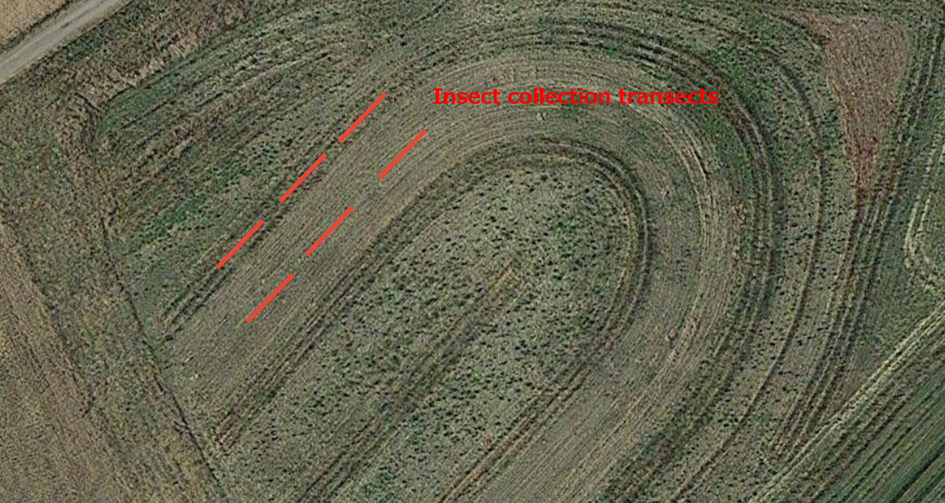
Abb. 5 Lage der Transekte für die Insektensammlung
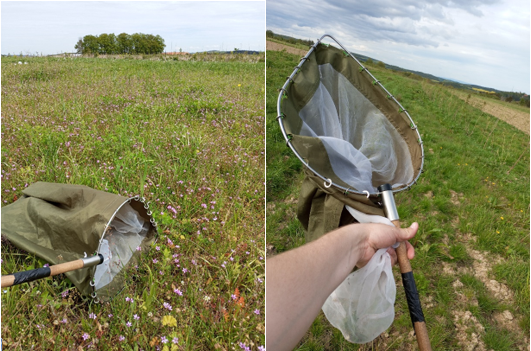
Abb. 6 Entomologisches Netz im Einsatz
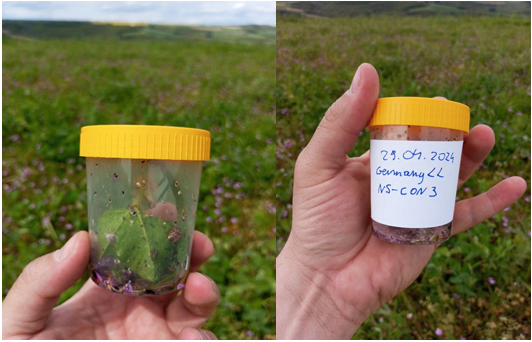
Abb. 7 Mit einem entomologischen Netz gesammelte Proben
Am ersten Tag der Überwachung bestand eine weitere Aufgabe darin, in den folgenden fünf Tagen Fallen zum Sammeln von Insekten aufzustellen. Es wurden zwei Arten von Fallen eingesetzt: Barber-Erdfallen und gelbe Bestäuberfallen. Diese Fallen wurden in Abständen von 10 Metern entlang der festgelegten Transekte aufgestellt, und zwar drei Fallen pro Variante (Abb. 8). Die Barber-Erdfallen mit einem Durchmesser von 10 cm waren für den effektiven Fang von Bodeninsekten konzipiert. Die gelben Bestäuberfallen mit einem Durchmesser von 30 cm wurden aufgrund der geringen Höhe der Vegetation direkt auf dem Boden aufgestellt. Beide Fallentypen wurden zu zwei Dritteln mit einer Lösung aus sauberem Wasser und geruchlosem Reinigungsmittel gefüllt (Abb. 9). Diese Lösungsformulierung gewährleistete ein schnelles Ertrinken der Wirbellosen und verhinderte gleichzeitig ein Überlaufen bei starkem Regen, ohne dass die Fallen angesichts der kurzen Sammelzeit abgedeckt werden mussten. Der Wasserstand wurde täglich aufgefüllt, um eine vollständige Verdunstung zu verhindern.
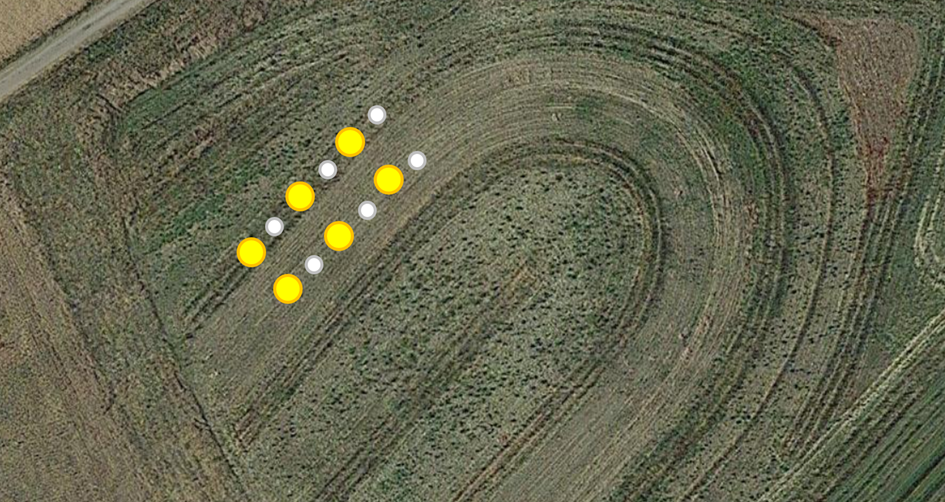
Abb. 8 Lage der Barber-Fallen und der gelben Schalen in der Mischnussanlage
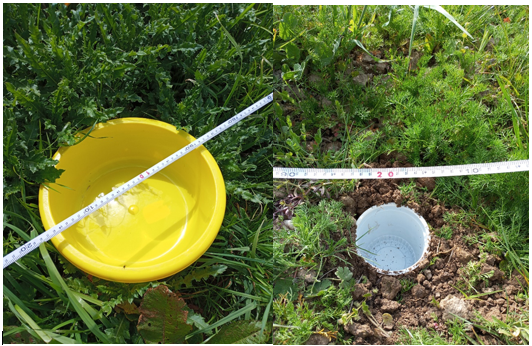
Abb. 9 Das Verfahren zum Setzen von Gelbschalen und Barber-Fallen
Tag 2 der Überwachung (23.04.2024): Die Bewertung konzentrierte sich auf die Artenvielfalt der Flora und die Primärproduktion. Innerhalb jedes der acht Transekte wurden vier Punkte für phytosoziologische Fotos mit einem botanischen Rahmen von 1×1 Meter ausgewählt (Abb. 10). Alle Pflanzenarten wurden identifiziert, und ihre Häufigkeit wurde gemäß den empfohlenen Feldprotokollen geschätzt. Die Daten wurden auf Feldformularen festgehalten (Abb. 11).
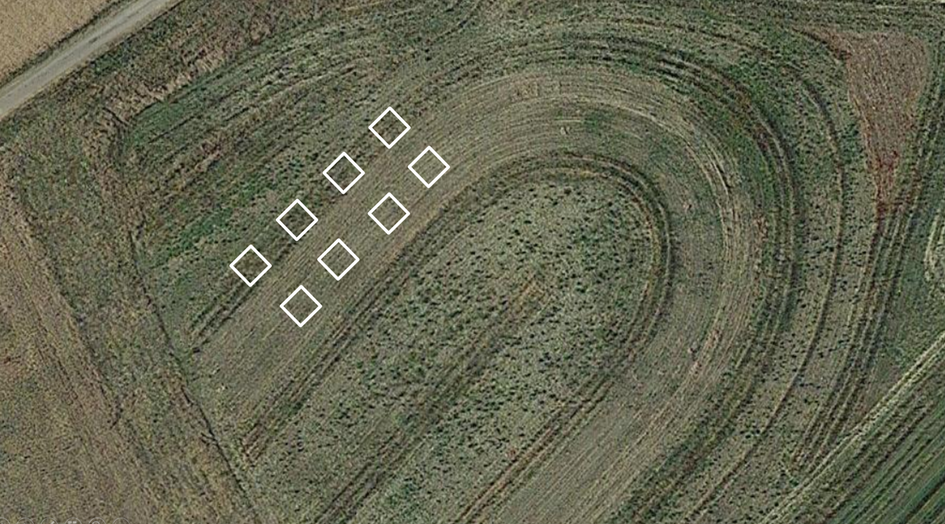
Abb. 10 Verteilung der Artenvielfalt und der Biomasseproben im gemischten Nusssystem
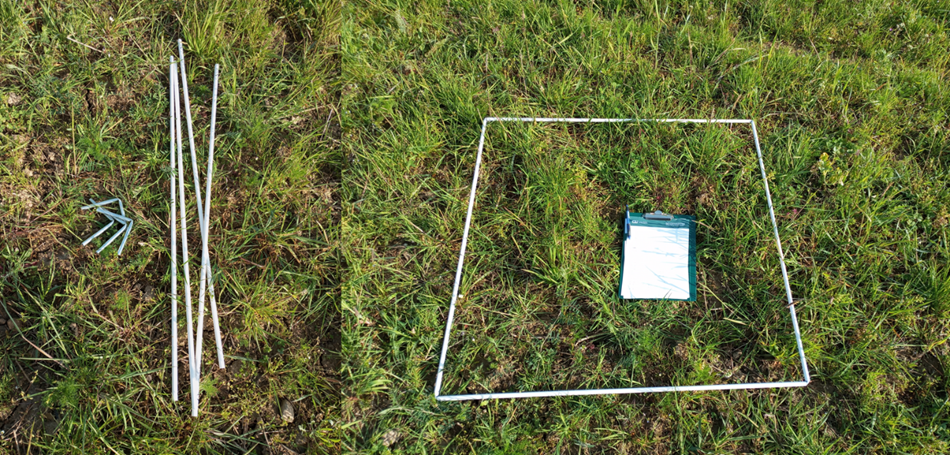
Abb. 11 Botanischer Rahmen und Feldformular für die Bewertung der Flora
Die Biomasse wurde innerhalb desselben Meterrahmens geschnitten, geerntet und gewogen (Abb. 12). Dies ermöglichte die Schätzung des Futterpflanzenertrags für Weidehühner oder die Bewertung der natürlichen Produktivität des Ökosystems (Primärproduktion), wenn die Biomasse nicht geerntet worden war. Zum Zeitpunkt des Monitorings wurde weder der Ertrag der vorhandenen Bäume ermittelt, noch wurden die Getreidefelder eingesät. Zusätzlich wurde eine fotografische Dokumentation der einzelnen Pflanzenarten in jedem System und ihrer Kontrolle durchgeführt (Abb. 13). Diese Fotos wurden auf iNaturalist hochgeladen, um die Artenbestimmung mithilfe von Algorithmen und nach Rücksprache mit Spezialisten zu überprüfen. Die Beobachtungen wurden mit Geotags versehen, um einen weltweiten Vergleich der Artenvielfalt zu ermöglichen (Abb. 14).
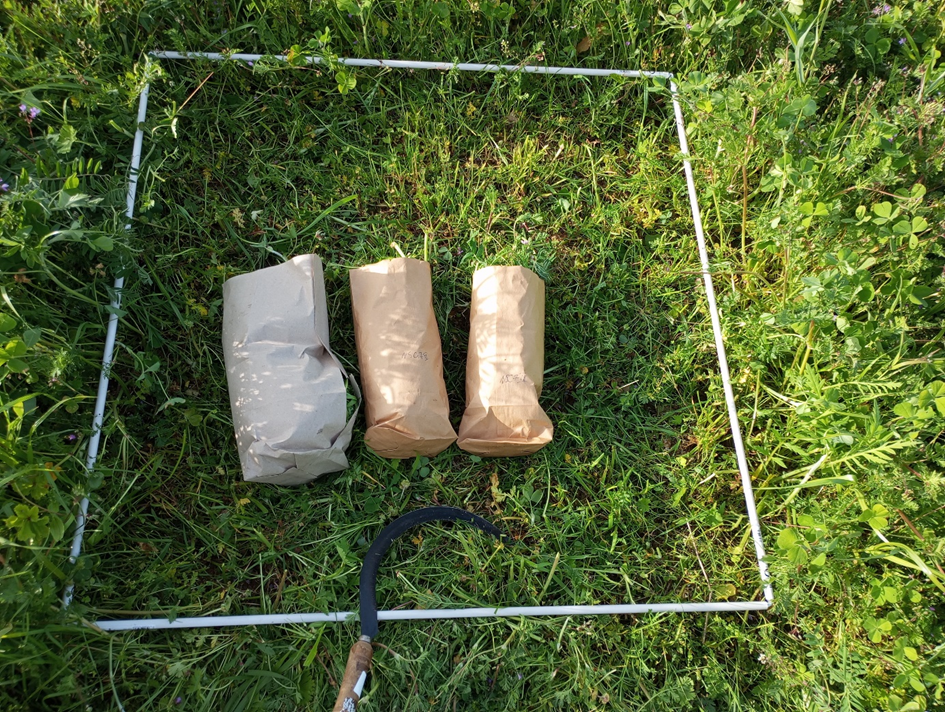
Abb. 12 Geerntete Futterbiomasse pro 1 m2
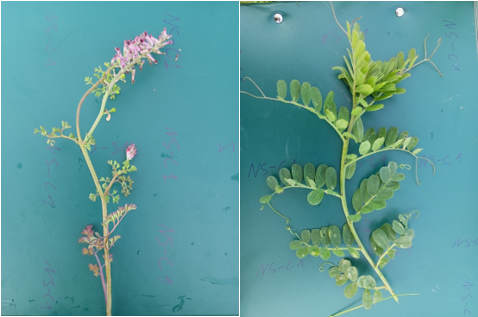
Abb. 13 Individuelle fotografische Dokumentation von Pflanzen
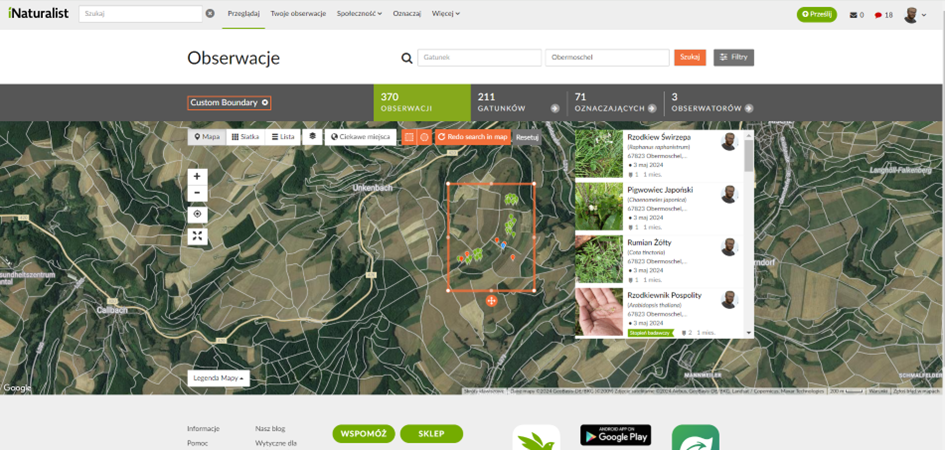
Abb. 14 Auf iNaturalist eingegebene Beobachtungen
Tag 3 der Überwachung (01.05.2024) - Die Aktivitäten konzentrierten sich auf die Untersuchung der Bodentiefe und das Sammeln von Regenwürmern. In den Bereichen, in denen am Vortag Biomasse gesammelt worden war, wurden 25 x 25 x 25 cm große Bodenblöcke ausgehoben (Abb. 15). Der Boden wurde vorsichtig auf einer Platte abgetrennt und weiter ausgegraben, um Zugang zum Unterboden zu erhalten. Für tiefere Bodenschichten wurde bei Bedarf ein Egner-Probenehmer eingesetzt (Abb. 16).
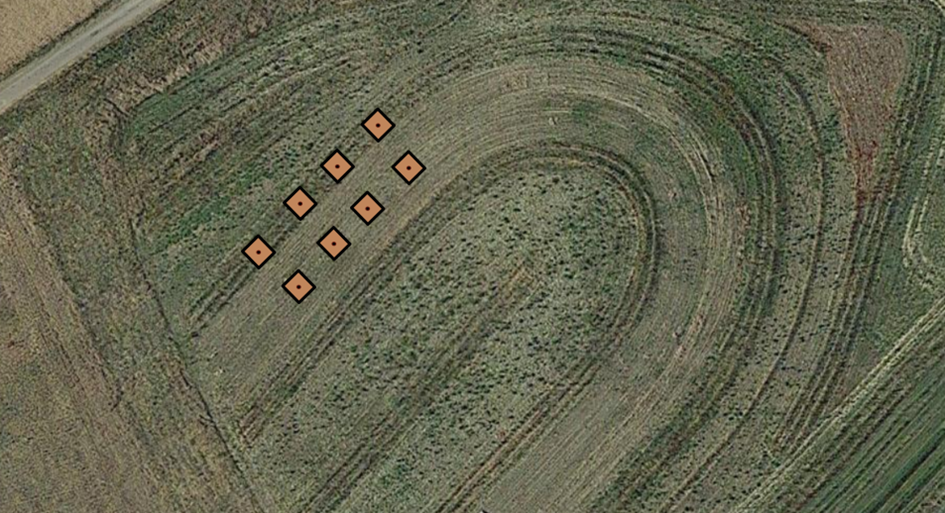
Abb. 15 Regenwurmsammelstellen und Bodentiefenmessungen
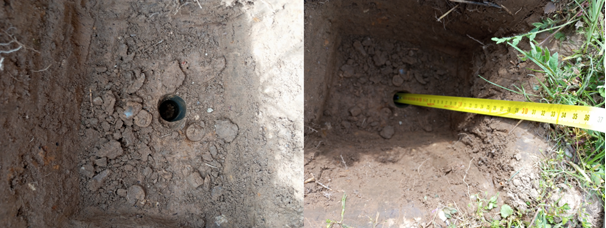
Abb. 16 Messung der Bodentiefe
Der auf der Folie ausgebreitete Boden wurde manuell gesiebt, um Regenwürmer zu extrahieren (Abb. 17). Die entnommenen Exemplare wurden in mit 75%-Alkohol gefüllten Behältern aufbewahrt, um sie anschließend zu wiegen und die Art zu bestimmen (Abb. 18).
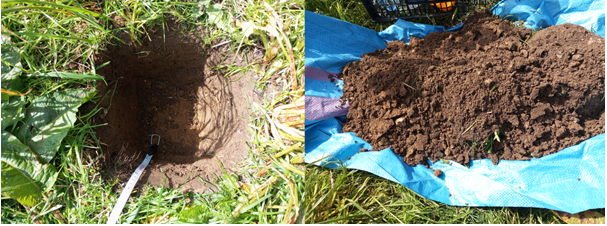
Abb. 17 Schneiden des Bodenblocks und Sieben des Bodens nach Regenwürmern
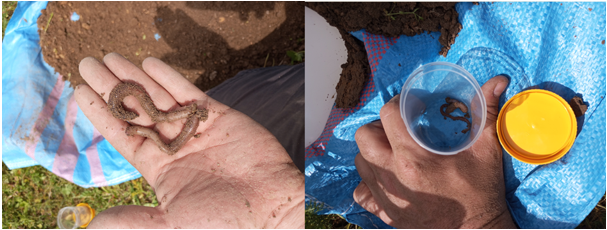
Abb. 18 Extraktion von Regenwürmern
Tag 4 der Überwachung (2. Mai 2024) - Es wurden Messungen der Schüttdichte und der Durchlässigkeit des Bodens durchgeführt. Die Proben wurden in dreifacher Ausfertigung an jeder vorgesehenen Stelle entnommen (Abb. 19). Vor der Probenahme wurden kleine Teile der Grasnarbe mit einem Spaten abgetragen. Für diese Untersuchungen wurden zwei Arten von Zylindern verwendet. Kleine Zylinder mit einem Durchmesser von 5 cm wurden in den Boden gerammt, um Proben für die Schüttdichte zu erhalten (Abb. 20). Die Proben wurden an beiden Enden mit Deckeln verschlossen und werden zu einem späteren Zeitpunkt zur Analyse an das Bodenlabor geschickt.
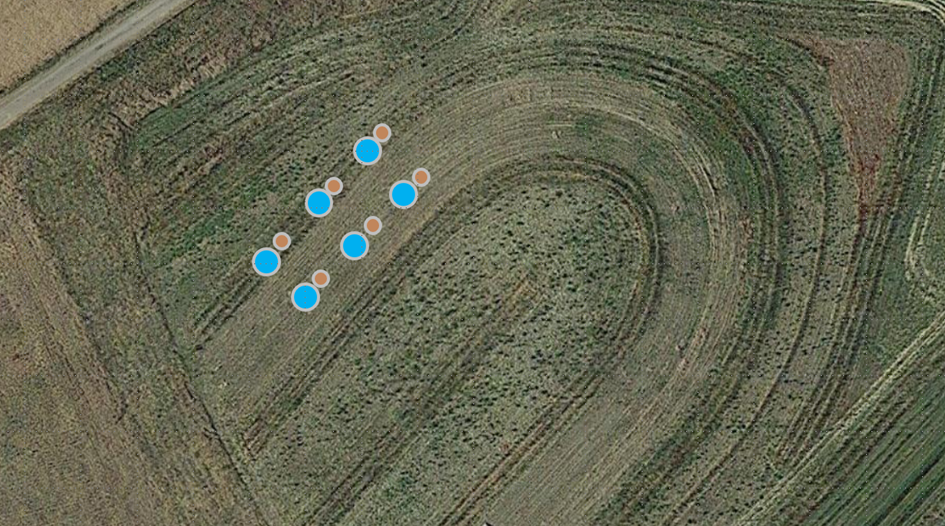
Abb. 19 Schematische Darstellung der Entnahme von Bodenzylindern und Durchlässigkeitstests
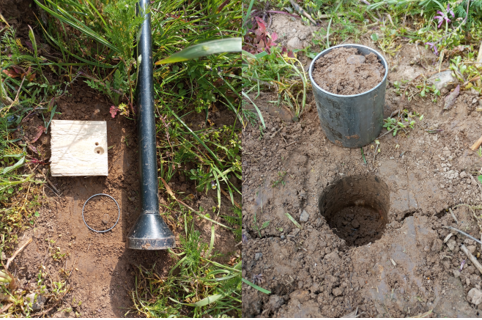
Abb. 20 Zylinderaufnahme für die Bodenschüttdichte
Die Durchlässigkeit des Bodens wurde mit Hilfe von Zylindern mit einem Durchmesser von 10 cm ermittelt, die bis zur vollen Tiefe in den Boden getrieben wurden, wobei 2,5 cm mit einem Holzstopfen freigelegt wurden (Abb. 21). Anschließend wurden 100 ml Wasser in den Zylinder gegossen, und die Gesamtinfiltrationszeit wurde mit einer Stoppuhr gemessen. Diese Messungen wurden auf den Felddatenblättern festgehalten.
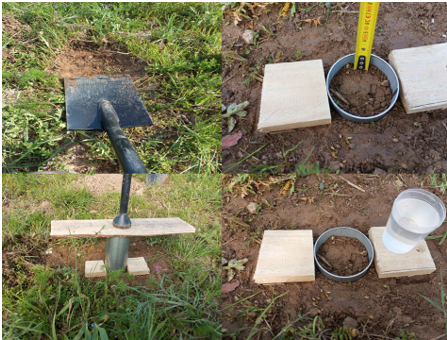
Abb. 21 Messung der Durchlässigkeit des Bodens
Tag 5 der Überwachung (3. Mai 2024) - Der Schwerpunkt lag auf dem Abschluss der Sammlung von Insektenfallen und Bodenproben. Die Insektenproben aus den gelben Schalen und den Bodenfallen wurden abgeseiht und in versiegelte Behälter mit Ethanol 75% umgefüllt (Abb. 22). Die Identifizierung der Insektenarten wird zu einem späteren Zeitpunkt durchgeführt.
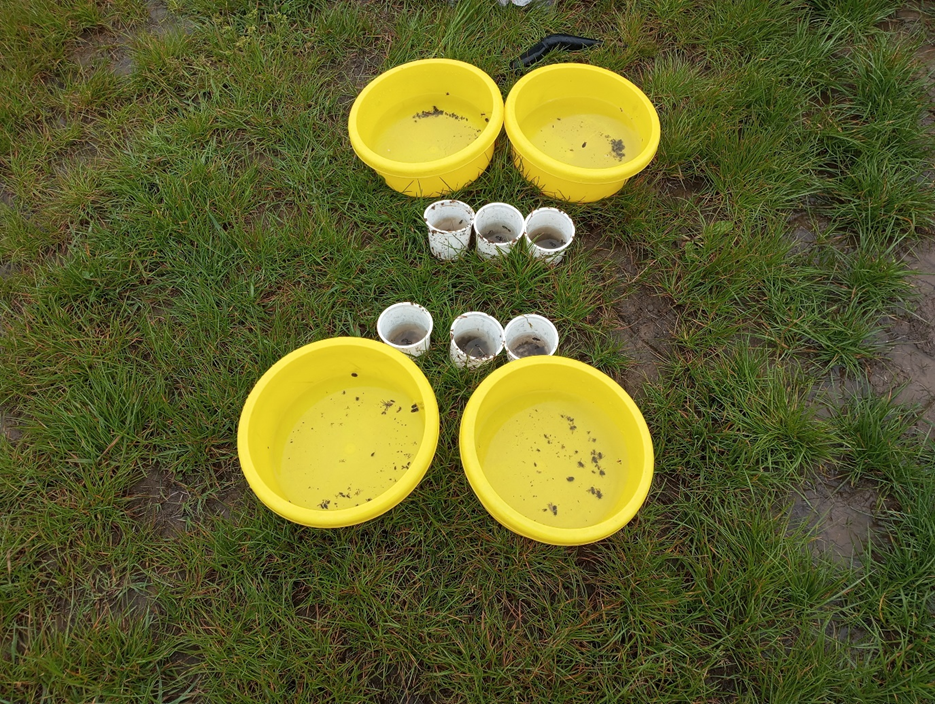
Abb. 22 Sammlung von Insektenfallen
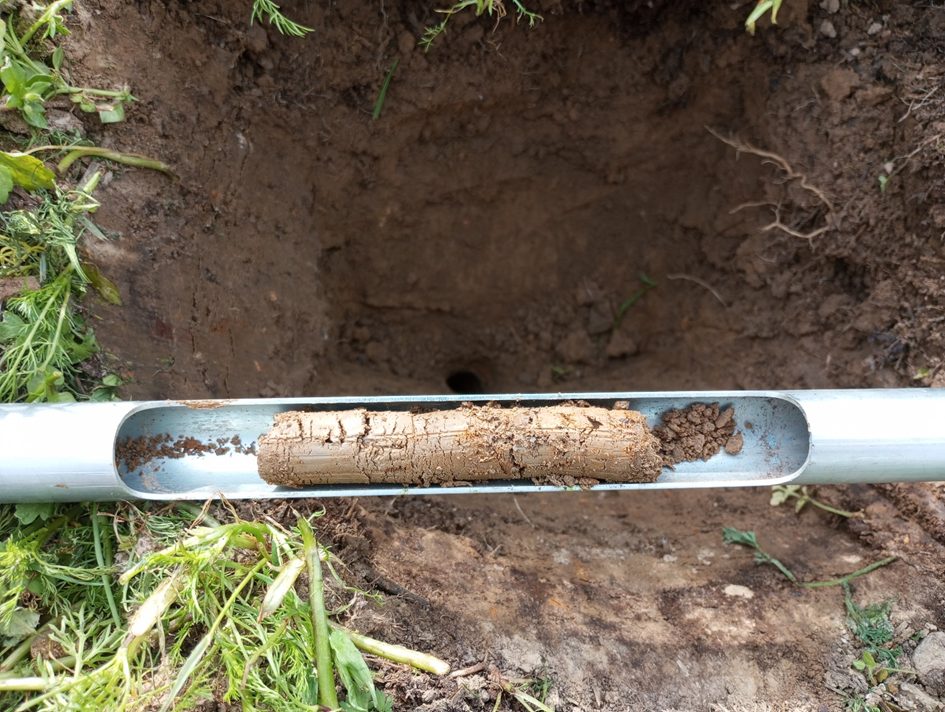
Die Bodenprobenahme erfolgte nach den Richtlinien des Feldprotokolls Aufgabe 3.2, wobei von jeder Variante vier Proben in Plastikbeuteln gesammelt wurden. Jede Probe bestand aus mindestens fünf Bohrkernen, die mit einem Egner-Probenehmer entnommen wurden (Abb. 23). Die Proben wurden bis zu einer Tiefe von 30 cm entnommen. Nach der Entnahme wurden die Bodenproben in einem Eisschrank aufbewahrt und nach der Rückkehr vom Feldbesuch tiefgefroren. Die Analysen der Bodenparameter werden zu einem späteren Zeitpunkt im Labor durchgeführt.
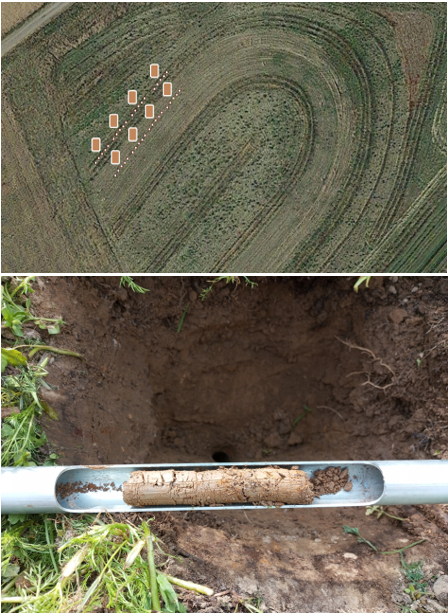
Abb. 23 Bodenprobenahmeplan (oben) und eine der fünf Teilproben (unten)